Long-Term Theme: Instacart Deep Dive
Alternative data can help investors increase conviction around unit economics, competition, and strategic initiatives for their long term holdings. Our Instacart (CART) research is a perfect example of differentiated granularity into fees, competition and SNAP benefit usage on the platform.
Average Discount as % of AOV (pre-discount)
Average Fees as % of AOV (pre-discount)
Our data suggested discount percentages increased in 4Q23, aligning with management’s comments on the recent 4Q23 earnings call:
“in Q4, we found more opportunities to invest in consumer incentives” - Nick Giovanni, CFO, 4Q23 Earnings Call, Feb 13, 2024
Fees as a percentage of Average Order Values (AOVs) have remained fairly steady through 4Q at roughly 6%, in line with levels observed since fees increased in early 2022.
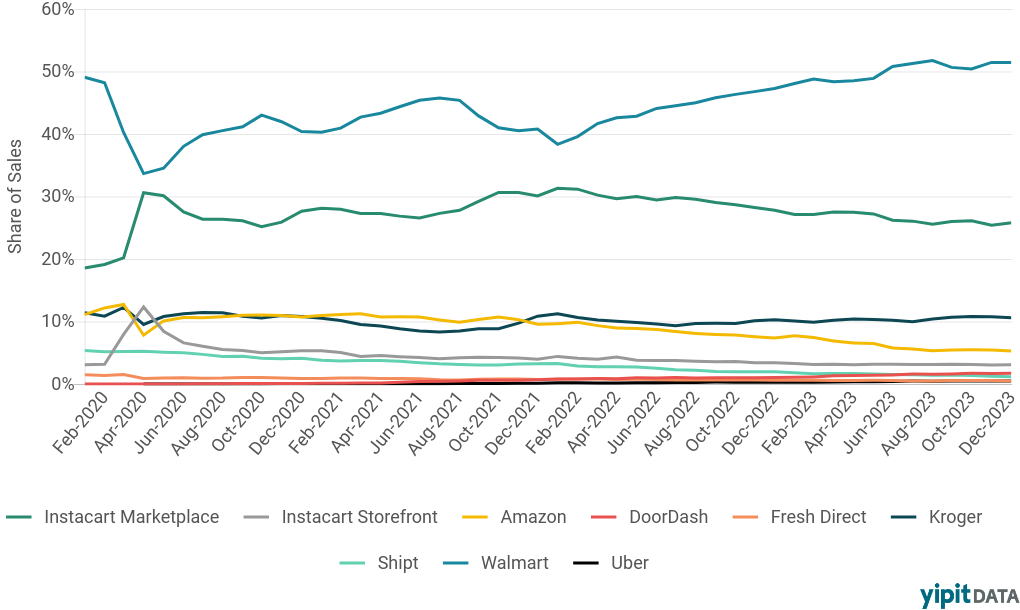
Share of Sales, All Tracked Platforms
Instacart marketplace represents roughly ¼ of tracked grocery sales in our panel, broadly losing share to Walmart (51%) since early 2022 when Walmart consolidated its online ordering platform, though with relatively steady share over the past few months.
Indexed Sales, Albertsons
Looking just at grocery sales from Albertsons - while DoorDash and Uber have scaled sales considerably since 2021 - the lion’s share of that volume has been incremental and not at the expense of Instacart sales.
EBT SNAP Share of CART Marketplace
Approximately 4% of CART's Marketplace sales and users could be attributed to EBT SNAP benefits in December, largely consistent with the levels observed since Jun-23 following the nationwide end of SNAP emergency allotments in Feb-23. EBT SNAP share of sales and users increased throughout 2021 following the pilot in late 2020 and expansion in late 2021.
In conclusion, our data allows for a deeper and differentiated profile on Instacart (CART) - with key trends including higher discounts and stable fees in 4Q, share losses to Walmart, Albertson’s delivery volumes by competitor, and sizing of the EBT SNAP business.


