

*Crate & Barrel includes CB2 sales; Bed Bath & Beyond does not include subsidiaries Harmon Face Values + Buy Buy Baby
Does not include Amazon, Walmart, Target as this index is focused on the pure play retailers
Source: Transaction data
Published 7/18/23
A real-time, granular view of your digital market share and why it’s changing.
Interested in learning more?
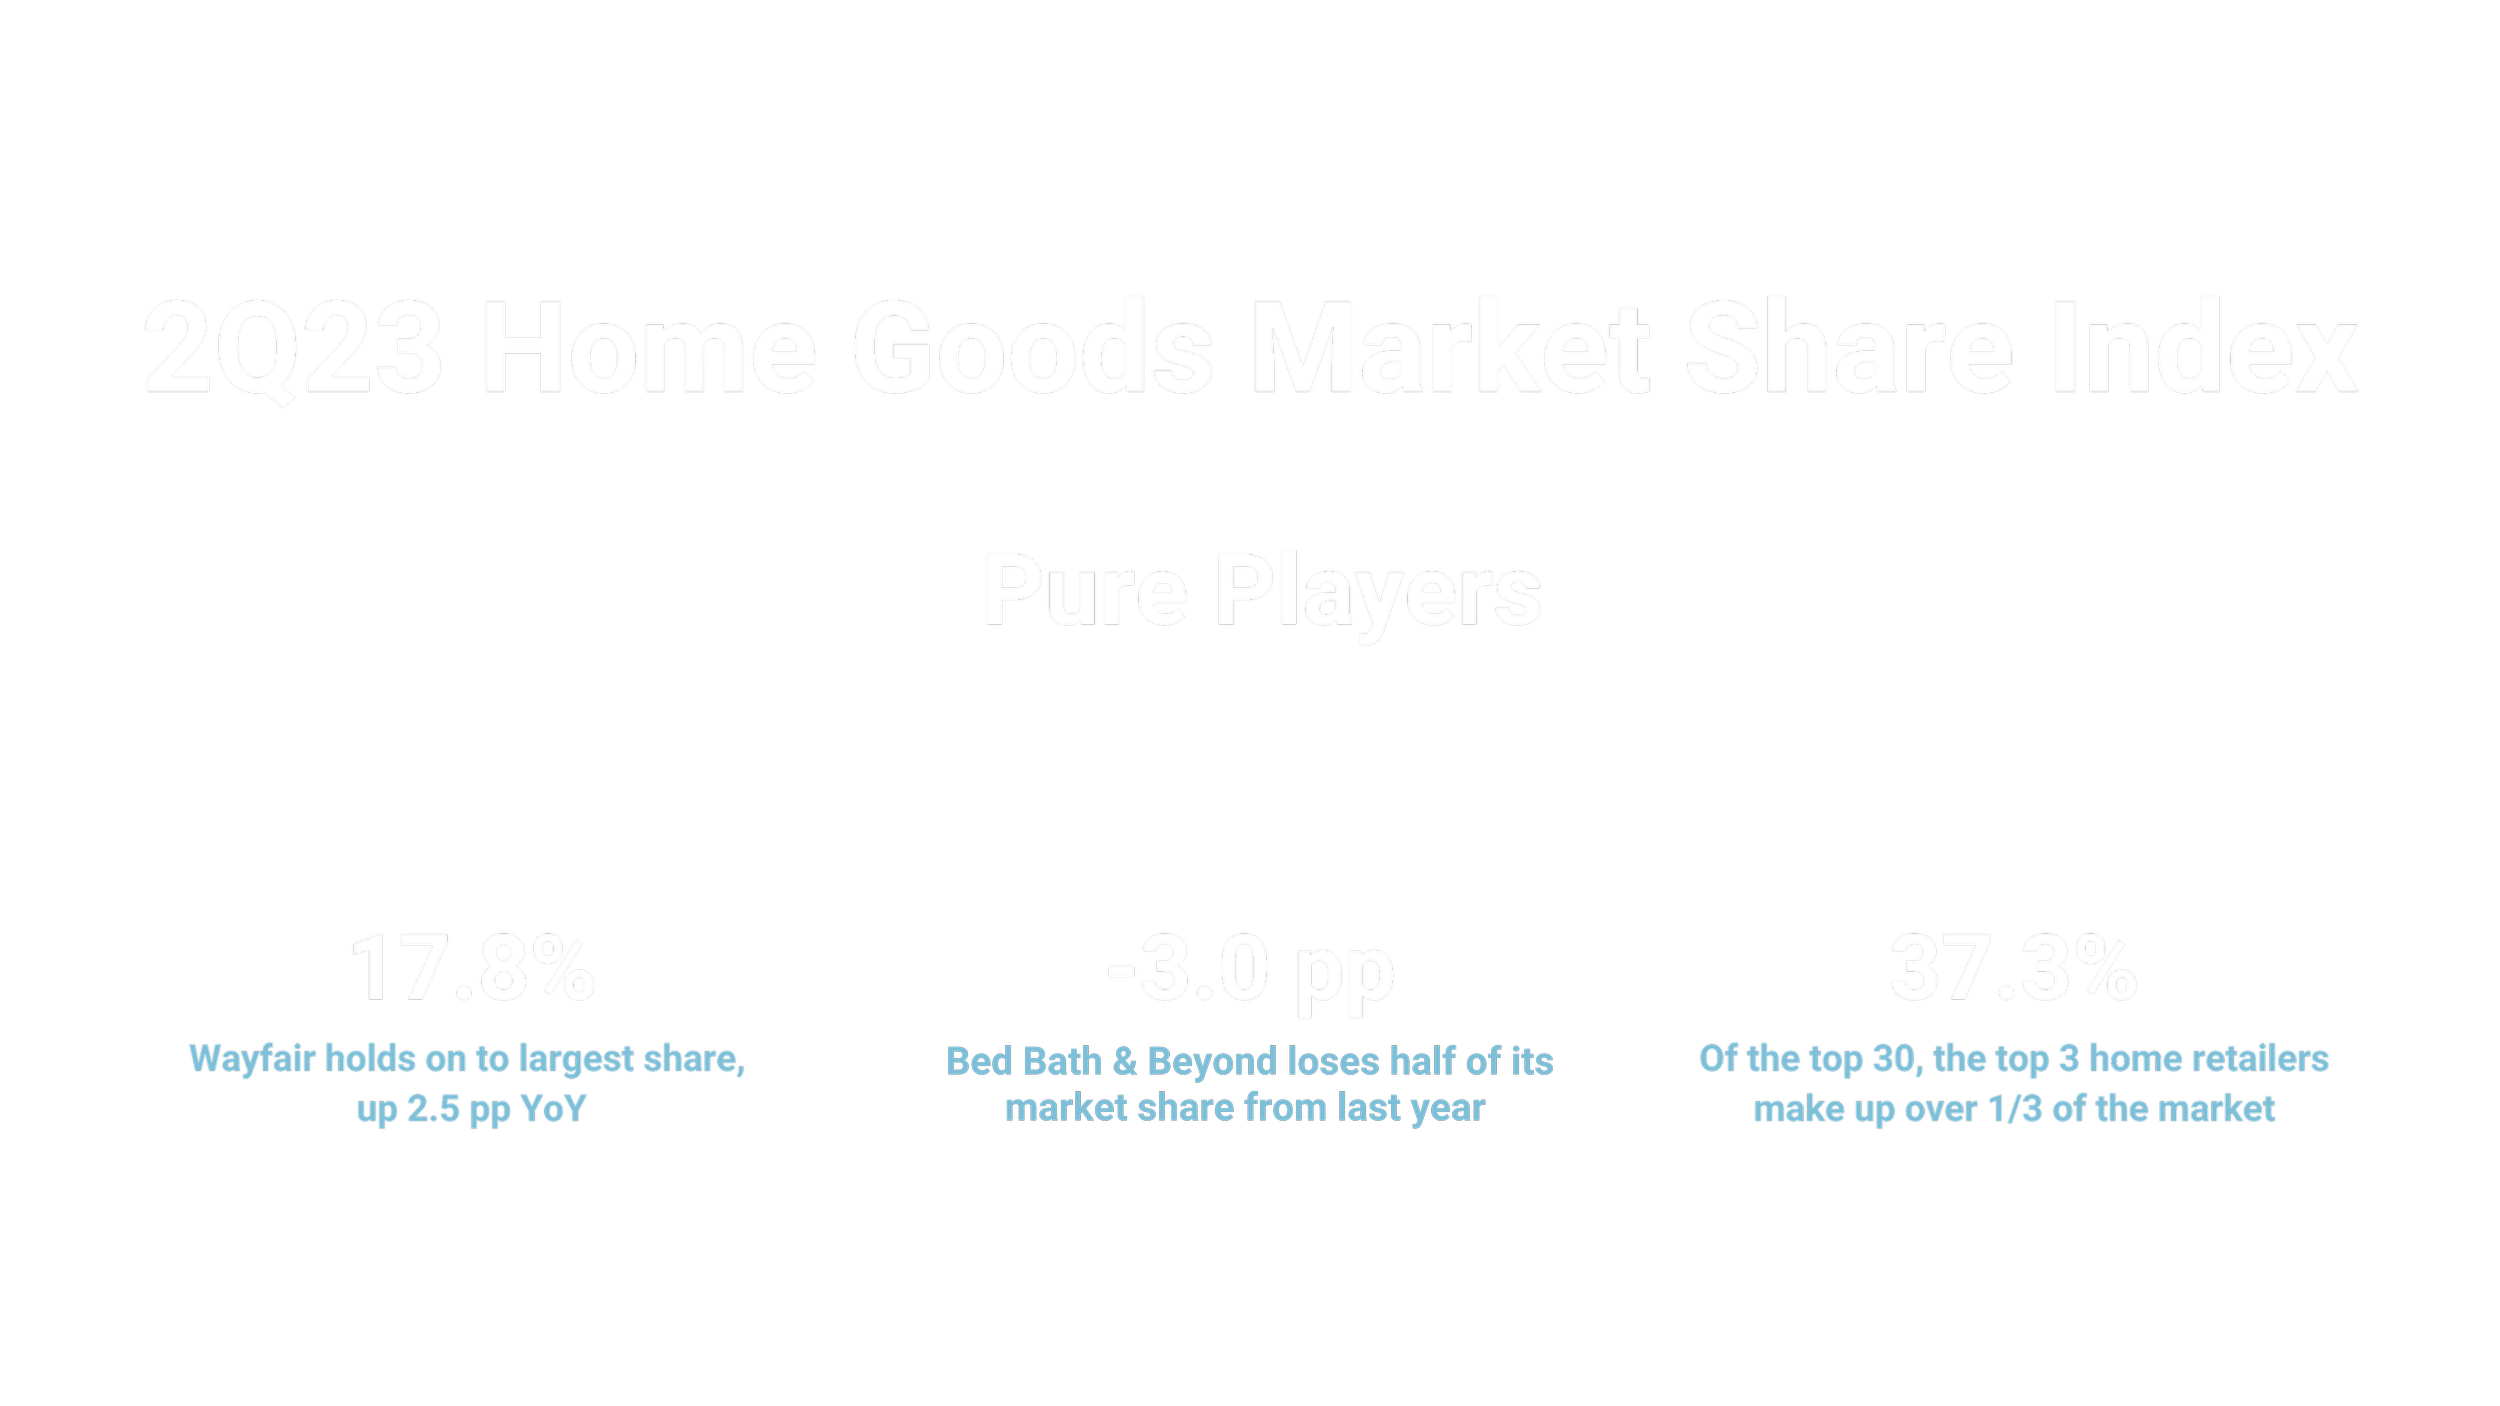
Key Takeaways
Quarterly Insights
Industry Performance
How is the industry fairing overall? The home market continues to shrink: total home goods GMV declined 11% in 2Q23 YoY.
Has demand for home furniture and goods maintained or is it tapering? 2022 was a tough year for the home goods industry with every quarter posting negative YoY sales growth ranging between -8% to -6%. 2023 continued that trend, with GMV growth falling further into double-digit negative growth.

2Q23 Spotlight
Bed Bath & Beyond

Overstock acquires BBBY
In June, Overstock announced its purchase of the former retail giant Bed Bath & Beyond (BBBY) which, according to our index, would essentially double Overstock’s market share in the home retail space.
At one point back in 2019, Bed Bath & Beyond had more sales than Wayfair. If Overstock can bring Bed Bath & Beyond to its former glory then it could prove itself to be a fierce competitor to Wayfair.

BBBY shoppers turning to Wayfair and HomeGoods
Bed Bath & Beyond (BBBY) shoppers are devoting more of their wallet to Wayfair and HomeGoods. In 2019, BBBY claimed a third of their shoppers' wallet share but over time BBBY shoppers shifted more and more of their spending to other retailers. In 2020, Wayfair surpassed BBBY for the largest wallet share of BBBY shoppers, and in 2023 now claims 27% wallet share to BBBY’s 10%. HomeGoods has also benefited from BBBY’s downfall with its wallet share growing 6 pp over the past 5 years to 22% share in 2023.
Overstock only had 4.5% wallet share of BBBY customers in 2023. With its recent acquisition of BBBY, Overstock now has the opportunity to lure BBBY shoppers back to BBBY and reclaim the precious wallet share that has been ceded.

BBBY shoppers spending across various Wayfair categories
Over the course of 5 years, BBBY shoppers have moved more and more of their spending away from BBBY and toward Wayfair. This graph provides insights into what product categories BBBY shoppers are going to Wayfair for. The categories included in this analysis are not exhaustive but represent the top 10 categories for BBBY shoppers at Wayfair.
BBBY shoppers who also shop at Wayfair are spending more of their money on beds, sofas, rugs, storage containers, and curtains at Wayfair than in previous years. Overstock could target these product categories as a way to lure BBBY customers away from Wayfair and back to BBBY, especially for storage and curtains which were weaker categories for Wayfair among BBBY shoppers in 2019.
*Wallet share is calculated by looking at sales generated from BBBY customers at the retailers listed in the legend.
About YipitData
YipitData is a trusted data partner for over 480 of the world’s largest investment funds and companies. We give retailers & brands accurate and granular market share insights across channels and categories, helping them identify opportunities to outperform.
Index References