

March 27 - 28 | Mandalay Bay, Las Vegas
Your source of truth for category and customer retail insights
Make smarter business decisions with visibility on your custom market share by brand, retailer, or vertical
Visit us
Booth 1904
Located close to the dining area at the entrance of the hosted meeting program
Retail insights tailored to answer your key questions
-

Market Share
Gain visibility into omni-channel market share in near real-time, in your categories across your key brands or retailers (incl Target, Walmart, Home Depot)
-

Customer Insights
Monitor changes in customer behavior with visibility on pricing, retention, and attachment rates for yourself and the competition
-

Sub-Category Analytics
Identify subcategory level trends across channels (B&M vs online) to identify opportunities for growth

Trusted by


Sectors We Cover


Interested in quick chat with our team at ShopTalk?
Additional resources
-
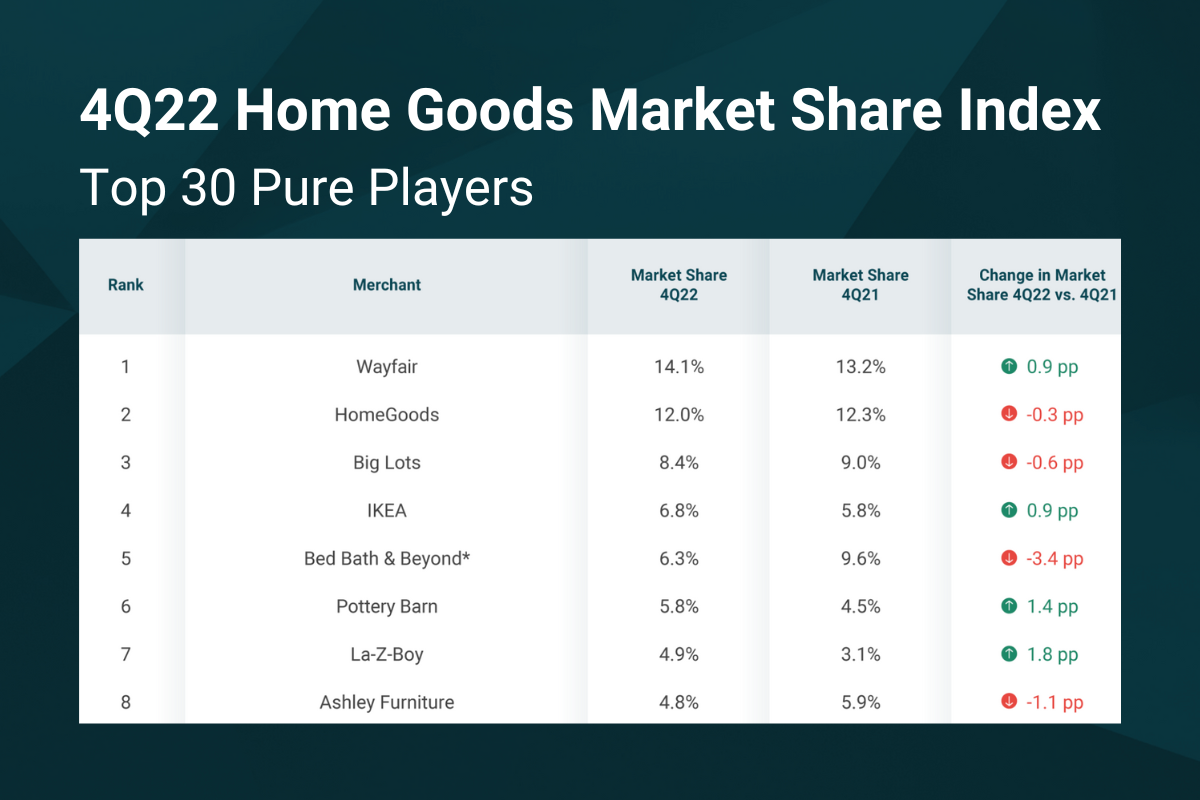
4Q22 Home Goods Market Share Index
Home Goods Market Share Index is a ranked list of the top 30 home goods pure players in the US. The index tracks GMV trends, measuring Y/Y growth and market share shifts.
-

Blog: YipitData Deep Dives
Our analysts take a deeper dive into topics of interest within the market's most disruptive sectors. Subscribe to our blog to get the most up-to-date insights delivered to your inbox.
-

Report: Home Goods Brand Dynamics on Amazon
YipitData’s Home Goods Brand Dynamics on Amazon report explores the competitive landscape, showcasing the brands and subcategories that are winning on the largest retail marketplace.